Your big picture game just got better!
Competitive data is essential in retail to remain relevant – and to thrive. To gain a competitive advantage, however, you need to look at data beyond spreadsheets of context-less numbers. Accessing deeper data insights on how your rivals think can give your company an edge because you can respond in real time.
That’s why we’ve added Relationship Charts, a new module within our price optimization tool, for you to gain an edge. It helps you draw comparisons between dynamic parameters and filters. Bottom line: You gain a magnifying glass to look into details your rivals can’t.

Illuminate Retail Decisions With More Concrete Facts
Retailers and brands are using competitive data to guide them toward better decisions based on facts, not hunches.
The detailed competitive data within Relationship Charts takes data further and can help you determine:
- The right positioning to differentiate their company and stand out in the crowded retail sector
- The right products to plan their assortment mix, including on-trend, classic, brands and private label
- The right prices by knowing what rivals do and which price points consumers are most willing to pay
This means that you can use our fancy new Relationship Charts to gain more clarity and certainty on how to adapt your strategy and outwit your competitors.
Here we explore some of the many ways you can do it.

Ensure Your Price is Right
Data from Relationship Charts can strengthen your pricing strategies by giving you more detailed market insights.
For instance, grocery retailers can use competitive analysis data to look deeper into specific categories, like frozen foods. The following table shows four UK grocery rivals (ASDA, Ocado, Tesco and Waitrose), the different flavors of sorbet they sell and the products’ price points.
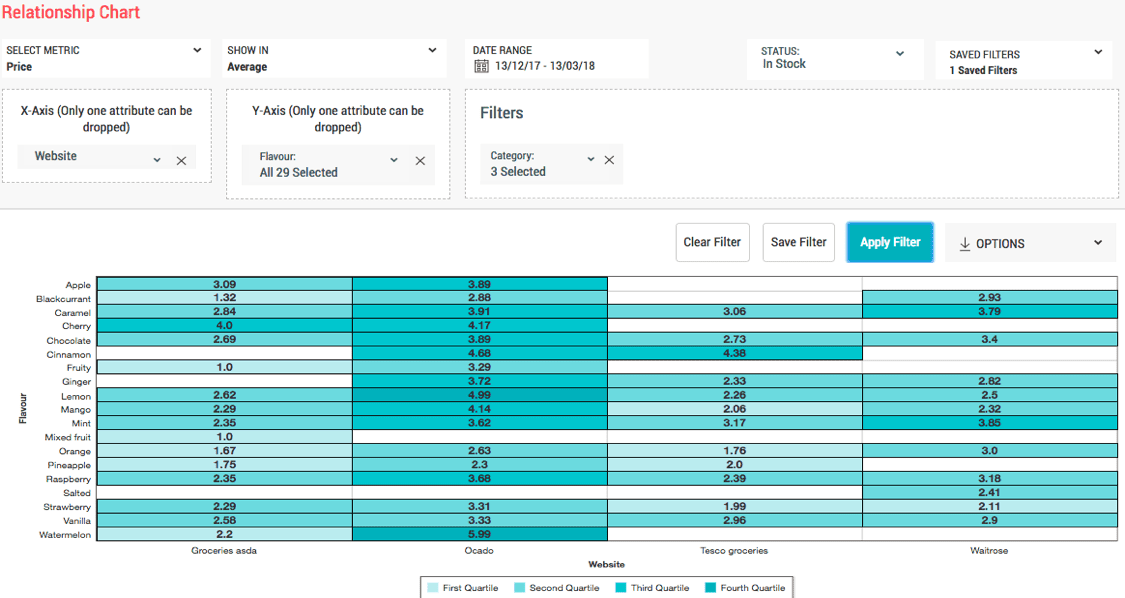
This Relationship Chart answers highly specific questions, like ‘Who stocks the most expensive lemon sorbet in the UK?. It takes 2 seconds to spot the fact that Ocado charges £4.99 per unit – nearly double the average price in your competitive landscape. A quick look, and you can tell that only ASDA stocks mixed fruit scoops for £1, which means ASDA can mark it up if there’s reasonable demand for the flavor.
Confidently Stock What Sells
Now you can access more information on what your rivals sell – so you know if (and where) you have gaps in your assortment and pricing strategies.
For instance, you can compare prices down to individual style attributes, like apparel with stripes.
You can now select multiple subcategories for a specific product attribute, like color or pattern. This capability is especially helpful when you want to filter larger comparisons of in-stock products and average price for multiple competitors for granular product specifications.
The table below shows five mass market fashion retailers in UK. It also plots the number of items with stripes per retailer according to price point.
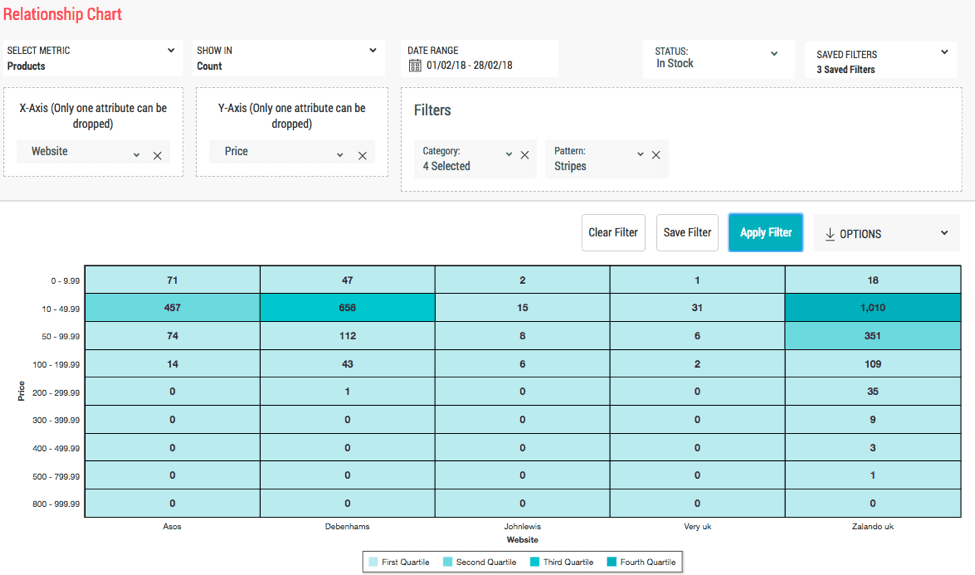
This comparison shows that Zalando UK sells the greatest number of items with stripes, ranging from £0 to £799.99. Also, the £10 to £49.99 price point is the most popular for Zalando UK, ASOS and Debenhams. We can easily see the most popular price points for striped apparel among these five retailers is £10 to £49.99, followed by £50 to £99.99.
Similarly, you can can benefit from Relationship Charts when making decisions on your own assortment and pricing strategies.
Know Where to Win the Global Beauty Battle
Don’t let the beauty market baffle you. Global brands compete for high margins amid crowded space. It’s easy to drown in the clutter unless you know how (and where) to get to your target audience.
Consider the following table, which shows US luxury department store Barneys, French cosmetics giant Sephora and American discounter Target. It also shows the cosmetics brands these retailers carry.
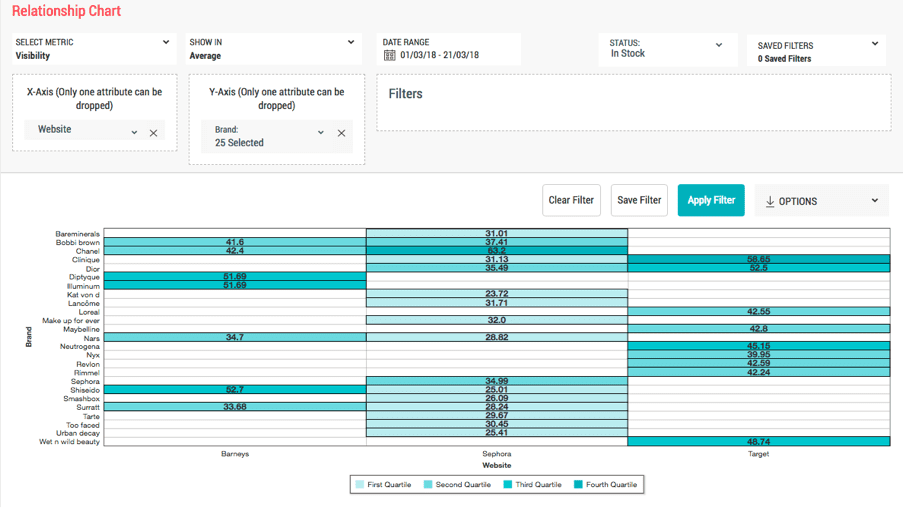
In a glance, you can tell which competitors push which cosmetics brands the most, boosting their online visibility ranking to the top pages. Specifically, Sephora favored Chanel while Target promoted Clinique on its product pages in March 2018. Meanwhile, Barneys heavily promoted Sheseido.
Visibility ranking comparison is now available for as many brands as you’d like. This feature is particularly important to understand where your brand is featured the most and which retailers need to emphasize your brand’s products for specific categories. For instance, if Lancôme wants to know where its mascaras stand next to Chanel’s on US beauty websites, it can do so in a matter of seconds and reframe its product positioning strategies accordingly.
Relationship Charts can help to shape your brand positioning and promotions, including specific eCommerce placement decisions.
Zeroing Down On it
To gain deeper insights into how any product is faring, retailers can now analyze three-dimensional relationships with multiple constrictions.
For instance, the following table shows an average price comparison on four websites. (Bloomingdales, Macy’s, Nasty Gal and Saks Fifth Avenue) for women’s jeans with a high rise fits that went out of stock in the past three months to consider their average visibility ranks for that period. That’s a dynamic relationship graph taking into account eight distinct parameters (!).
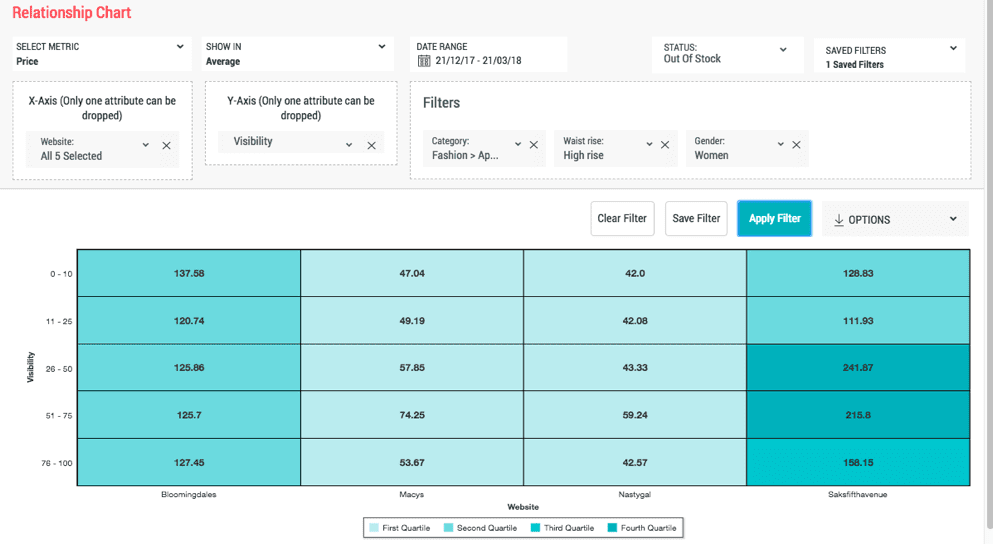
The data insights reveal that Saks Fifth Avenue had the highest visibility ranking for high rise women’s jeans that went out of stock in the past three months.
Relationship Charts can help you scrutinize finer competitive data in real time. This information can help you make decisions on inventory planning, assortment planning and promotional efforts to boost online visibility.
Bottom Line: Competitive Data With The Right Context Drives Business Results
Whether you work in grocery, beauty, apparel or another category, you know how much retail competition has intensified. The examples illustrated above are only a fraction of applications our shiny new tool can be used for to drive smarter, actionable decisions. It’s time to get the full picture. Look beyond your spreadsheets of sales data and review competitive data insights, so you can outsmart your rivals, sell more and gain a lasting advantage.
View competitive data for your brand compared to your competitors’ brands. At Intelligence Node, we’re making the data work for you so you don’t have to work for it. Get a free assessment!
